Fig. 5.
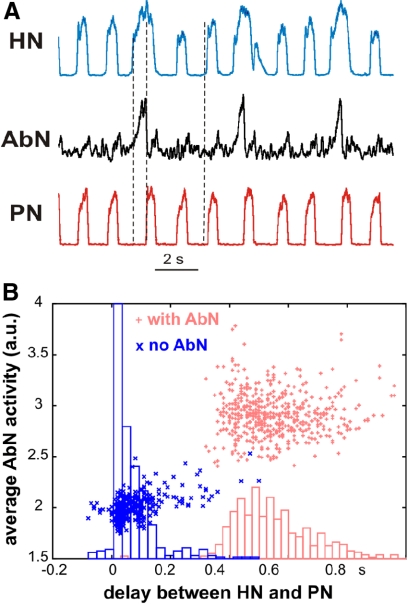
Effect of late-E activity on the temporal relationships between PN and HN bursts. A: integrated activities of PN (bottom trace, red), AbN (middle trace, black), and HN (top trace, blue) nerves during hypercapnic (7% CO2) regime corresponding to a 1:3 ratio between AbN and PN frequencies. The delay between onsets of PN and HN bursts is substantially longer when late-E bursts are present in AbN than when they are missing (shown by dashed vertical lines). The earlier onset of HN discharges coincides with AbN late-E bursts and the delayed onset of PN bursts coincides with the termination AbN late-E discharges. B: the delays between onsets of HN and PN bursts are indicated by small red pluses in the presence of AbN activity and by small blue crosses in the absence of AbN bursts. The corresponding histograms show the distributions of delays between HN and PN onsets for the 2 cases, when AbN bursts are present (red) and when they are missed (blue).

