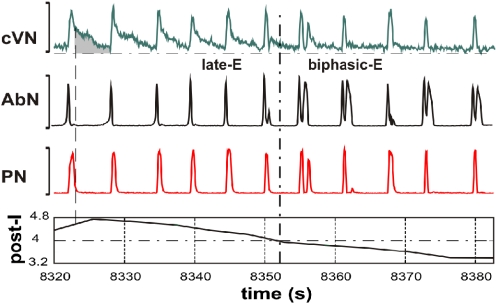
Fig. 6.
Transformation of the pattern of abdominal activity from late-E (pre-I) bursting to biphasic-E discharge during hypercapnic anoxia (7% CO2, 93% N2). The top 3 traces show integrated activity of cVN, AbN, and PN nerves. The bottom trace represents the index of postinspiratory (post-I) activity calculated as an averaged activity in cVN during the expiratory phase in each cycle (shown as the gray area in the cVN trace); the expiratory phase was defined by the PN trace (vertical dashed line indicates the onset of expiration). In the 1st half of the recorded episode, only late-E bursts were present in AbN. The post-I component of cVN was progressively reducing. The transition of AbN bursts to a biphasic-E discharge pattern (with pre-I and post-I components) occurred after a significant suppression of the cVN post-I activity (indicated by vertical and horizontal dash-dotted lines).

