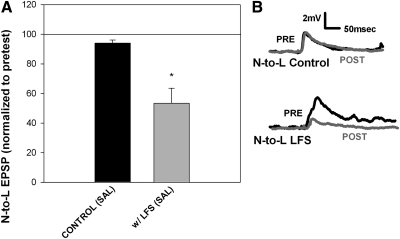
Fig. 2.
Heterosynaptic LTD at the N-to-L synapse. A: bar graph showing that 15 min of LFS (1 Hz) of the T cell synapse produced a heterosynaptic LTD in the N-to-L synapse (n = 6) compared with controls tested without LFS (n = 9). Data were analyzed using a 1-way ANOVA [F(1,13) = 10.18; P < 0.01] with a post hoc Newman-Keuls test (*P < 0.01). B: sample traces showing no change in N-to-L EPSP amplitude in the control experiments (top) and a decrease in EPSP amplitude in synapses following T cell LFS (bottom). Pretest traces are indicated by a black line and posttest traces are represented by a gray line.

