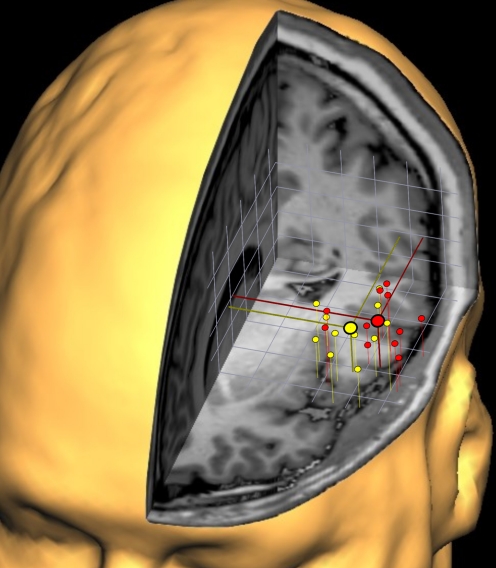
Fig. 4.
Three-dimensional clustering of the individual cortical responses obtained within SII following laser hand (red) and foot (yellow) stimulation. To gain an impression of the variability of cortical representations within SII, the individual activations of all subjects (n = 11) were projected onto 1 subject's 3-dimensional reconstruction of the brain. The individual coordinate systems were aligned to the anterior commissure and the AC-PC plane. Despite the overlap between the scatterings of the red and yellow symbols, a systematic difference in medial-lateral direction is visible, and the average localizations for hand and foot representation are illustrated by the large symbols. Grid width: 1 cm.

