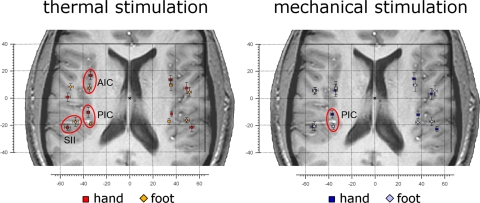
Fig. 5.
Somatotopic representation of hand and foot following noxious stimulation. Left: the average location of the activations in response to heat (laser) stimulation of the hand (red squares) and foot dorsum (orange diamonds) in each ROI. As indicated by red ellipsoids, the location of the activations was significantly different (circled in red) in the contralateral anterior insula, posterior insula, and parietal operculum (SII; for a quantitative description of location differences see Table 1A). Right: the average location of the activations in response to pinprick (punctate probe) stimulation of the hand (dark blue squares) and foot dorsum (pale blue diamonds), in each ROI. The location of the activations was significantly different in the contralateral posterior insula (for a quantitative description of location differences see Table 1B). In all panels, error bars represent SE. The left side of the brains is shown on the left. AIC, anterior insular cortex; PIC, posterior insular cortex; SII, secondary somatosensory cortex.

