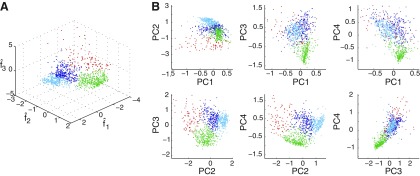
Fig. 4.
A: clustering of 1,000 randomly selected events (across all patients) passing through stage 2, in the 3-dimensional space defined by f̂1, f̂2, and f̂3. Each of the 4 clusters found by the algorithm is colored uniquely. B: the points on the left projected onto all possible pairs of principal components; axes are scaled to enable better visualization of cluster boundaries, so a small number of outlying points are not visible.

