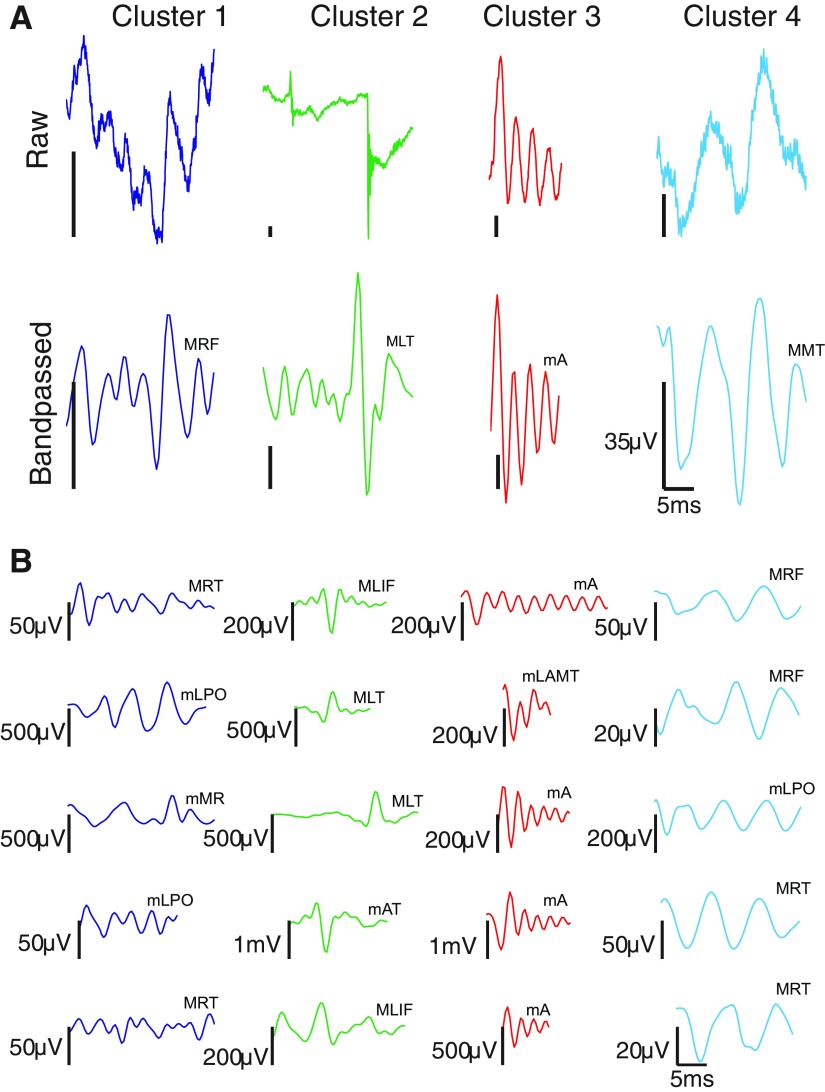
Fig. 5.
Characteristic waveforms derived from clustering all 290,273 events, across all patients, that passed through stage 2. A: cluster prototypes found by taking the cluster member nearest in the Mahalanobis sense to the cluster mediod in feature space. Top images are unfiltered waveforms; bottom images are the corresponding 100–500 Hz band-pass filtered waveforms [to facilitate comparison, events are plotted on identical time axes (0 to 25 ms; axes suppressed in individual plots), with events truncated to 25 ms if longer than this duration]. Vertical scale bar is 35 μV; horizontal scale bar is 5 ms. B: 5 randomly selected events from each cluster (band-passed waveforms only). In the abbreviations above each trace, the first letter indicates whether the recording comes from a macro- (M) or microelectrode (m). RF, right frontal; LT, left temporal; A, anterior; MT, middle temporal; RT, right temporal; LPO, left parietooccipital; MR, motor; LIF, left inferior frontal; AT, anterior temporal; LAMT, left anterior mesial temporal. Note that identical labels do not imply identical electrodes, only that the electrodes have the same lobar location.

