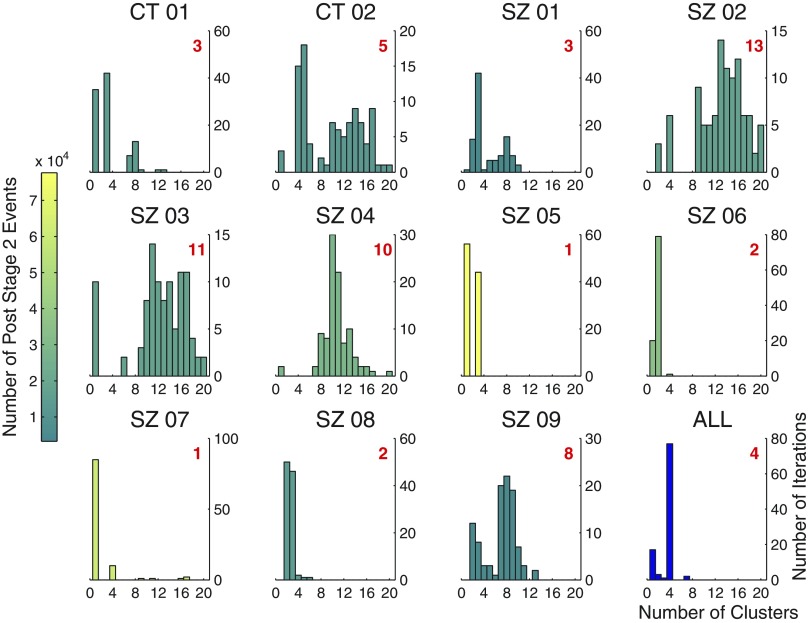
Fig. 6.
Individual subject clustering. Each panel (except the bottom rightmost panel) gives the results, for a single subject, of an experiment in which 100 random samples of size equal to 25% of all events passing through stage 2 for the subject were clustered. Number of clusters found by the algorithm is plotted on the x-axis. Number of iterations is plotted on the y-axis. Shown in red is the mode of each distribution, which can be interpreted as the number of clusters found by the algorithm for that subject. Histograms are colored in proportion to the relative number of events passing through stage 2 for each patient. The bottom rightmost panel gives the results of a similar sampling experiment performed on the aggregated data, the only difference being that random samples of size 5% of the total were used, instead of 25%, to ease the computational burden.

