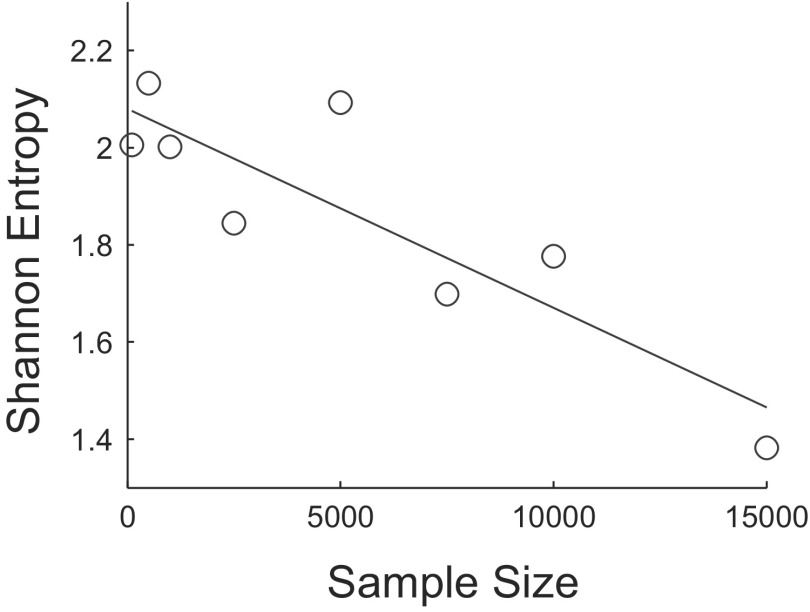
Fig. 8.
Scatterplot of sample size vs. the Shannon entropy of the distribution of the number of clusters returned by the algorithm for the aggregated data. Distributions were formed at each sample size by making 100 random draws from all post stage 2 detections. The equation for the regression line is y = −4.09 × 10⁻⁵x + 2.08.

