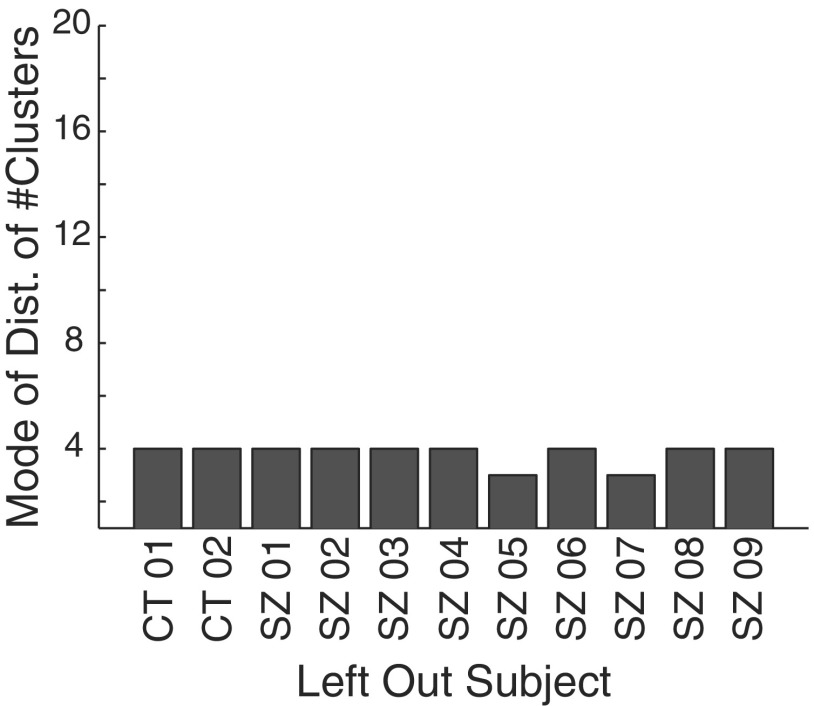
Fig. 9.
Results of an experiment in which each subject, in turn, was left out of the clustering. Five thousand randomly selected events from all events passing through stage 2 in the remaining patients were then clustered in 25 iterations. The x-axis shows the subject that was left out. The y-axis shows the mode of the distribution of number of clusters found in each of the 25 iterations.

