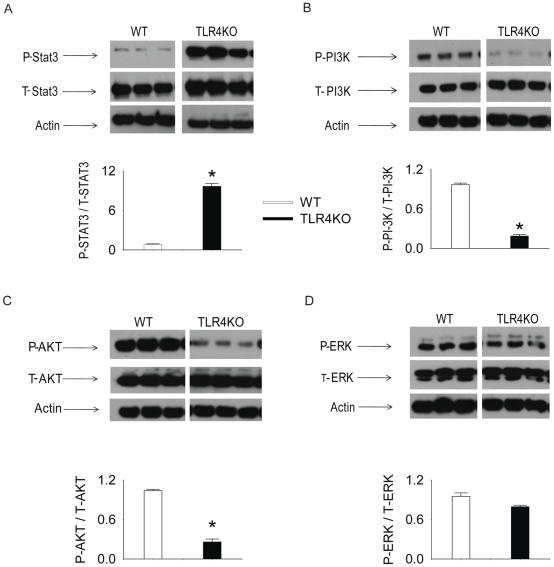
Figure 5. Intracellular kinase activation in WT and TLR4KO MSC.
WT and TLR4KO MSC were plated in 12-well plates (0.05×10⁶ cell/well). After 24 h, cell lysates were collected and the activation of of STAT3 (A), PI-3K (B), AKT (C) and ERK (D) were measured by Western blot. The upper panels in each subfigure show the representative Western blots. The lower panels of each subfigure represent the quantified signal ratio of the activated form to total form (or actin loading control) from the Western blot. The data represent three independent experiments. Results are mean ± SEM, n = 3–4 group, * p<0.05 vs. WT control. Representative blot out of 4 independent experiments are shown.

