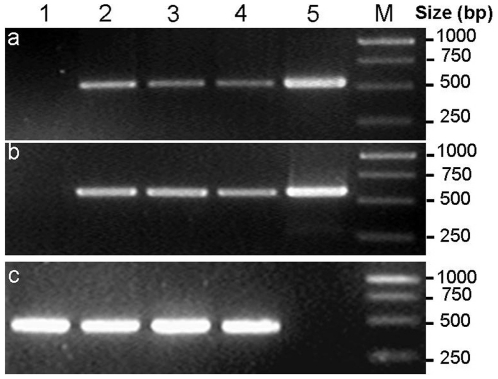
Figure 4. Semi-quantitative RT-PCR analysis of p35 and op-iap expression in three T3 transgenic cotton lines.
Semi-quantitative RT-PCR products from RNA extracted from the young leaves of three T3 transgenic plants and non-transformed negative controls. (a) p35 expression. (b) op-iap expression. (c) house-keeping gene histone-3 expression. Lane 1 the negative control plant; lanes 2, 3, 4 the three T3 transgenic lines (KB1, KB2, KB3); lane 5 the p1301-p35-iap co-expression vector control; lane M molecular mass marker is GeneRuler TM 1 kb DNA ladder (MBI Fermentas, Maryland, USA).

