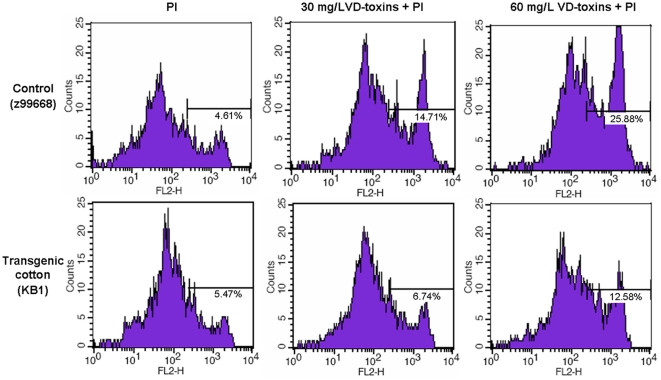
Figure 8. Flow Cytometry Analysis of Cell Death Induced by VD-toxins.
The protoplasts isolated from the T3 transgenic lines (KB1) and non-transformed negative controls were treated with 30 mg/L and 60 mg/L VD-toxin for 3 hours and analyzed by flow cytometry after PI staining. Flow cytometry analysis was conducted using 10,000 protoplasts per sample. Percentages of dead protoplasts are indicated. Vertical axis refers to PI fluorescence intensity and the abscissa refers to the number of protoplast. Data are representative of three independent experiments.

