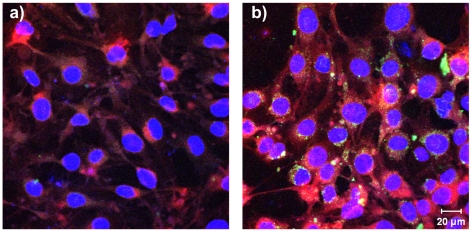
Figure 1. Cellular uptake and intracellular distribution of the nanoparticles studied by CLSM.
bEnd3 cells were cultured on collagen IV-coated glass slides and were treated with a) PEGylated HI 6 dichloride monohydrate-loaded nanoparticles or b) ApoE-modified HI 6 dichloride monohydrate-loaded nanoparticles for 4 h at 37°C. The green autofluorescence of the nanoparticles was used for detection. Red: cytosol stained with CellTracker™ Red CMTPX, blue: nucleus stained with DAPI. Pictures were taken within inner sections of the cells.

