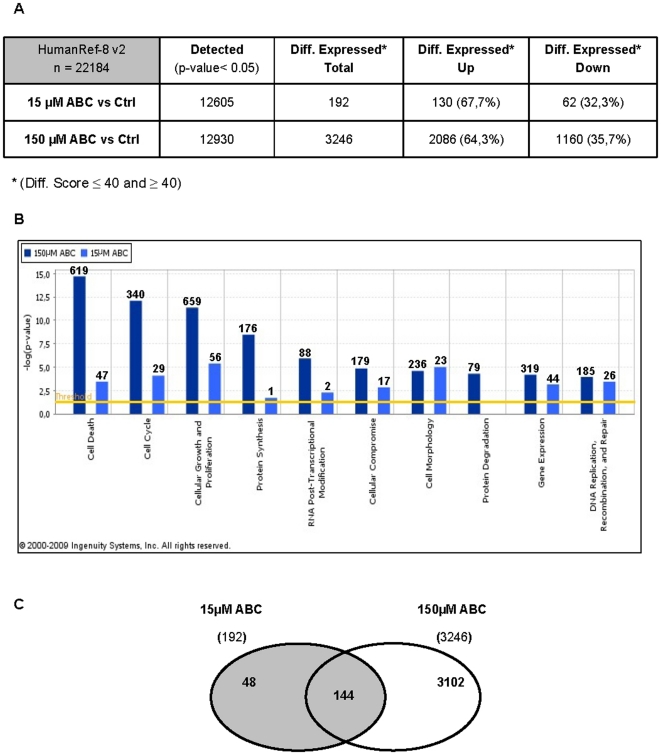
Figure 6. PC3 microarray analysis results.
(A) Summarizing chart of the expressed and differentially expressed gene numbers resulting from microarray assay (four biological replicates for each condition). (B) Comparison of the top-ten biological functions at 15 and 150 µM ABC obtained by IPA analysis. On the y-axis the statistical significance, expressed as -log/p-value, is reported. Threshold p-value = 0.05 (yellow line). The number of the genes involved in each function is reported on the top of each bar. (C) Venn diagram showing the fraction of common genes differentially expressed in PC3 cells at 15 and 150 µM ABC.

