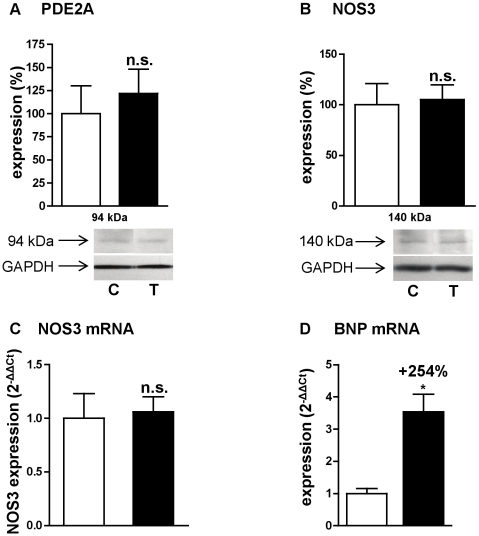
Figure 7. Effects of angiotensin II treatment on PDE2, BNP and NOS.
Expression of PDE2A protein (A), NOS3 protein (B), NOS3 mRNA (C) and BNP mRNA (D). Effects on treated rats (T, ▪; n = 4) were compared with control rats (C, □; n = 4). Western blot results were normalized with GAPDH signal and expressed in percentage of untreated rat. Q-RT-PCR results were normalized with the 18S rRNA housekeeping gene and expressed as amplification folds relative to control. n.s.: not significant; *: P<0.05.

