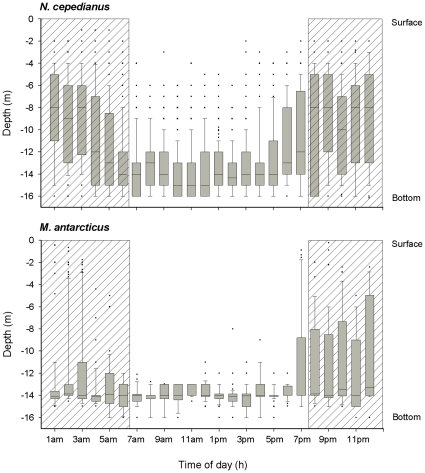
Figure 2. Diel pattern in depth use for N. cepedianus and M. antarcticus in southeast Tasmania.
Box plots show the median (line within the boxes), interquartile ranges (boxes), 10th and 90th percentiles (whiskers) and outliers ( ) of depths detected during each 1 h interval. For each species, data from the whole sampling period was pooled. Dashed area indicates nocturnal period.

