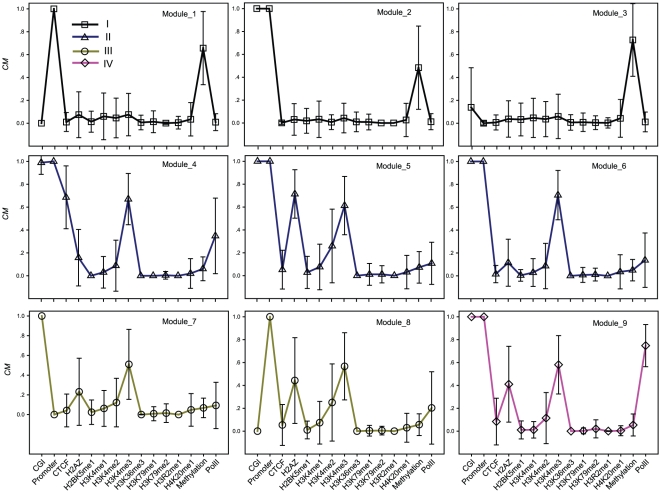
Figure 3. The homogeneity based clustering.
Nine modules with distinct (epi)genomic patterns, involving significant features based on regression analysis. X-axis: the significant epigenomic features from Table 1, excluding histone acetylation marks. The order of features is arbitrary. Y-axis: the closeness of features around CpG loci as measured by CM. Symbol height represents the median CM value. Error bars represents standard error. The number under the Module_i (I = 1, …,9) is the count of CpG loci in Module_i, The specific proportion of each module is shown in Figure 4A. Modules are roughly classified into four meta-groups according to genomic elements and PolII patterns, as indicated by the four colors.

