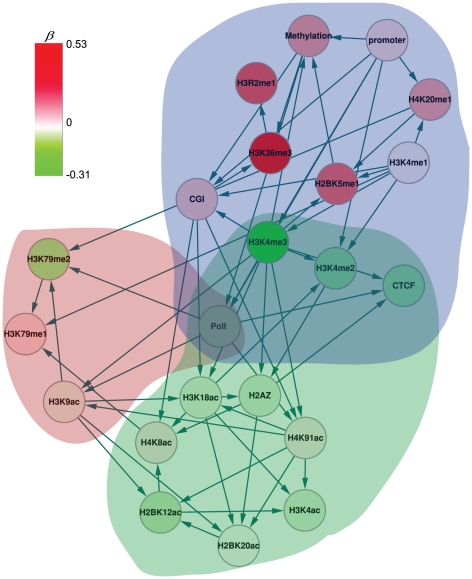
Figure 5. The global Bayesian network inferred from the complete CM profile.
The red, blue and green circles represent different groups. The node color is mapped by the color key in the left top corner, representing the coefficients of the regression model (Table S2).

