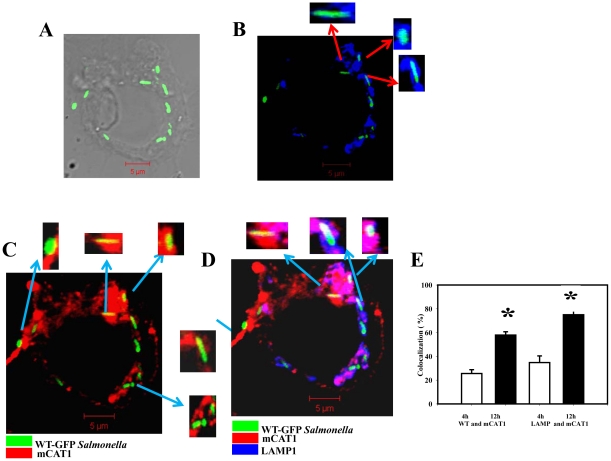
Figure 8. Intracellular Salmonella colocalizes with the host mCAT1 in the BMDMs at late time point of infection.
BMDMs were infected with WT Salmonella for 12 h and the staining was done as described earlier. (A) Representative image for the localization of the WT-GFP (green) in grey scale image. (B) Image for the localization of the WT-GFP (green) and LAMP1 (blue). The colocalization gives rise to cyan colour. Inset: enlarged image of the bacteria containing vacuole. (C) Image for the localization of the CAT1 (red) and WT-GFP (green). The colocalization gives rise to yellow colour. Inset: enlarged image of the bacteria containing vacuole. (D) Image for the localization of the CAT1 (red) and WT-GFP (green) and LAMP1 (blue). This gives rise to the same bacteria having both the LAMP and mCAT1 immuno-staining, enlarged bacteria are shown in the insets. The colocalization of the three colours gives rise to white colour. (E) The percent colocalization of WT Salmonella with mCAT1 at 4 (white bar) and 12 h (black bar) post infection. The colocalization (%) of WT-GFP Salmonella with mCAT1 is plotted after counting from 50 fields in three independent experiments. Out of total bacteria the number of yellow bacteria was counted in those fields and colocalization (%) was plotted. The amount of LAMP1 colocalized to the mCAT1 protein is also shown. For this purpose, the colocalization efficiency of Blue that colocalized with Red and gave rise to magenta colour was counted. Statistical significance was tested by comparing the 4 h values with that of the 12 h values an defined as follows:* P<0.05 (Student's t test).

