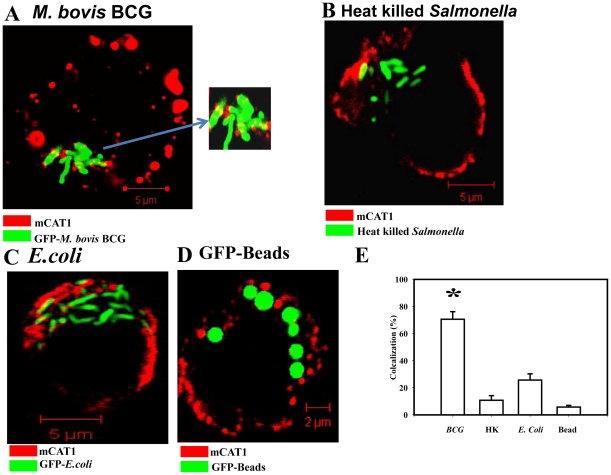
Figure 9. mCAT1 distribution pattern in the BMDMs after infection with various other pathogens or conditions.
(A) Intracellular M. bovis BCG (GFP) colocalizes with the host mCAT1 protein in BMDM after 12 h of infection. The sites of colocalizations were detected by immunostaining with an anti-mCAT1 antibody and a Cy5-conjugated secondary antibody. Samples were analyzed by confocal laser-scanning microscopy and representative images for the localization of the BCG-GFP (green) and the mCAT1 (red) are shown. Inset: enlarged image of the bacteria containing region. (B) Heat killed Salmonella (GFP) after 12 h of infection in BMDM is shown in green and mCAT1 shown in red. Staining was done as described earlier. (C) BMDMS were infected with the dh5a E.coli strain (GFP) at a MOI of 10 for 12 h and staining was done as described earlier. (D) BMDMs were allowed to phagocytose inert latex beads (GFP, Ratio of 1∶25) and fixed after 12 h post phagocytosis. Staining was done as described earlier. (E) The percent colocalization of BCG, Heat killed Salmonella (HK), E.coli or GFP beads (Beads) with mCAT1 are plotted after counting from 50 fields in three independent experiments. Out of total bacteria/bead the total number of yellow bacteria/beads was counted in those fields and colocalization (%) was plotted and the significance was tested after comparing any group with the GFP-Bead's colocalization values. Statistical significance was defined as follows:* P<0.05 (Student's t test).

