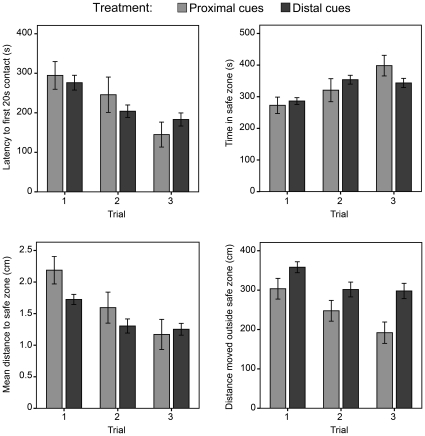
Figure 3. Performance of flies in locating the safe zone using either proximal cues (i.e., non-spatial task; n = 20) or distal visual cues (i.e., spatial task; n = 20).
Note: Flies presented either the non-spatial and spatial tasks improved their performance in locating the safe zone: the latency before a 20 s contact with the safe zone decreased (proximal: F (1,52) = 11.57, p = 0.001; distal: F (1,224) = 16.32, p<0.001), the time spent in the safe zone increased (proximal: F (1,52) = 16.03, p<0.001; distal: F (1,223) = 10.67, p = 0.001), the mean distance to the safe zone decreased (proximal: F (1,52) = 10.23, p = 0.002; distal: F (1,224) = 13.81, p<0.001) and the distance moved outside the safe zone declined (proximal: F (1,52) = 9.33, p = 0.003; distal: F (1,224) = 8.37, p = 0.004) with trials. The comparison between non-spatial and spatial tasks revealed no significant differences (latency before a 20 s contact: F (1,294) = 0.17, p = 0.68; time in safe zone: F (1,293) = 0.01, p = 0.93; mean distance to the safe zone: F (1,294) = 3.18, p = 0.08), except for a larger distance travelled in the spatial task (F (1,294) = 12.96, p<0.001). Male and female flies were pooled. Error bars indicate standard errors.

