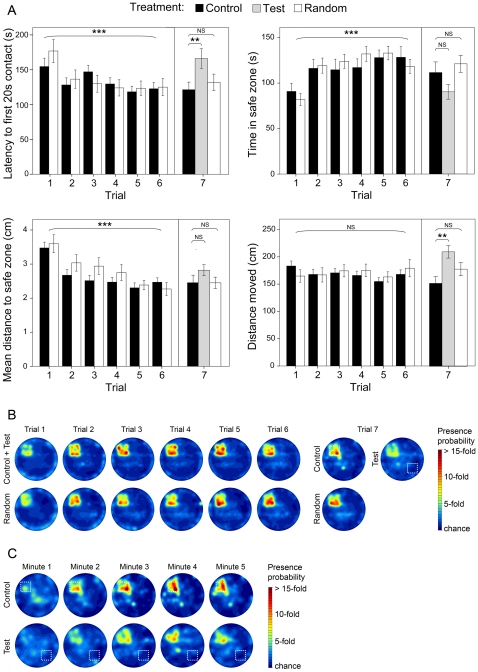
Figure 4. Spatial learning in Drosophila flies.
Note: (A) Latency before 20 s contact, time spent in the safe zone and mean distance to the safe zone showed a significant improvement after six 5 minute trials for both control and random groups of flies. Most measured variables showed this trend: the latency before a 20 s contact diminished linearly (linear within subject contrast: F (1,77) = 19.6, p<0.001), the time spent in the safe zone increased (F (1,79) = 20.6, p<0.001), the mean distance to the safe zone declined (F (1,78) = 24.84, p<0.001). In contrast, the distance moved outside the safe zone did not improve (F (1,78) = 3.8, p = 0.06). Wall pattern reversal significantly altered the ability for test flies to locate the safe zone as shown by their latency to reach the safe zone and their overall distance moved (Dunnett's test for multiple comparison: latency fo first 20 s contact: p = 0.004; distance moved: p = 0.002). Test flies were also undistinguishable from naïve flies for three variables (latency before 20 s contact: t(115) = 0.01, p = 0.99; time in safe zone: t(112) = −0.75, p = 0.45; distance moved outside safe zone: t(115) = −1.67, p = 0.10). Control flies were significantly different from naïve flies for all variables (latency before 20 s contact: t(117) = 2.17, p = 0.03; time in safe zone: t(112) = −2.36, p = 0.02; distance to safe zone: t(117) = 3.51, p = 0.001; distance moved outside safe zone: t(117) = 2.02, p = 0.05). Performance from the random group of flies improved throughout trials (linear within subject contrast: latency before 20 s contact: F (1,38) = 11.6, p = 0.002; time in safe zone: F (1,39) = 9.89, p = 0.003; distance to safe zone: F (1,39) = 10.3, p<0.001; distance moved outside safe zone: F (1,39) = 0.3, p = 0.92). Statistical significance is indicated with asterisks for linear within subject contrasts and Dunnett's tests (***: p<0.001; **: p<0.01; NS: non-significant). N = 120 female flies. (B) Presence probability plots of control, test and random groups during each 5 minute trials of experiment 2. All groups developed a positional preference for the safe zone through trials. During the seventh trial, test flies displayed a reduced positional preference for the safe zone in comparison to control flies. The white dashed square represents the expected position of the safe zone relative to distal visual cues. (C) Presence probability plots of control and test flies during each minute of the seventh trial of experiment 2. Wall pattern reversal resulted in a both delayed and less intense positional preference for the safe zone in test flies when compared to control flies.

