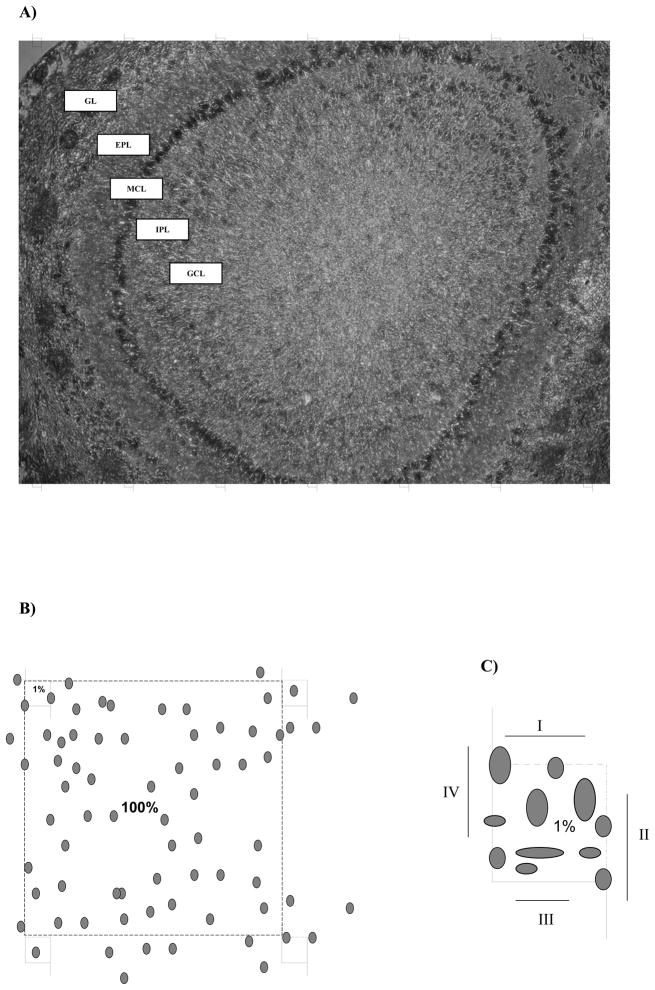
Fig. 6.
Diagrammatic summary of the sampling scheme used to estimate total number of GCs in the GCL of the MOB of rats at PD 7 (see text). (A): Low power micrograph of a 16-um-thick cryostat section from olfactory bulb. Superimposed on the section are the grid that illustrates the relative size of the optical dissectors used for counting and the distance between optical dissector samples. GC: glomerular layer; EPL: external plexiform layer; MCL: mitral cell layer; IPL: internal plexiform layer; GCL: granular cell layer. (B): Demarcation of the knowing area (100 %) to determine the dissector area (1%). (C): Each dissector has two borders to cells inclusion (I, II) and two of exclusion (III, IV).

