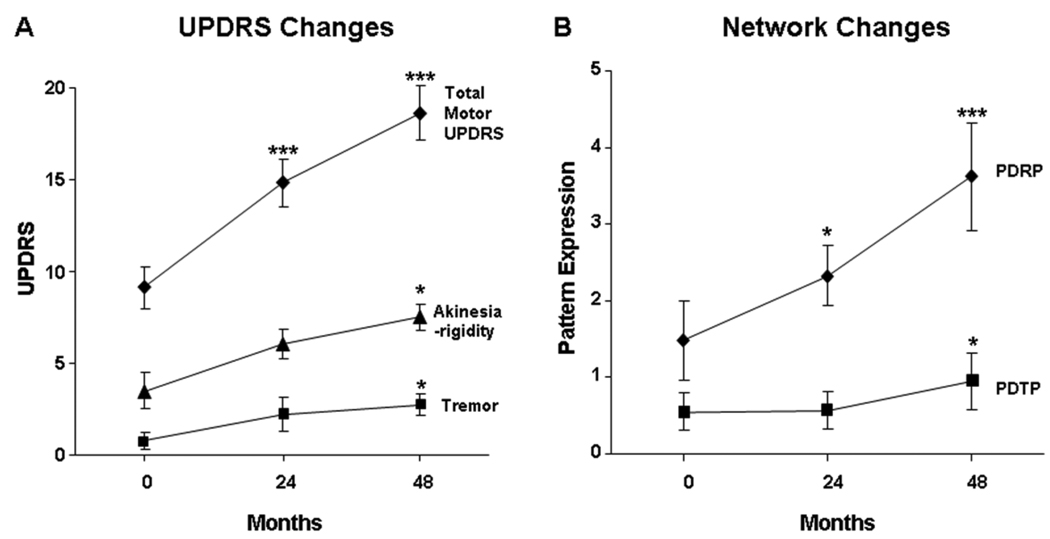
Figure 4. Changes in PDTP expression with disease progression.
A. Mean (±SE) off-state total motor UPDRS ratings (diamonds), and akinesia-rigidity (triangles) and tremor subscale ratings (squares), from a longitudinal cohort of early stage PD patients (n=15) followed at baseline, 24, and 48 months (Huang et al., 2007b). These ratings worsened over time (total motor UPDRS, p<0.0001; akinesia-rigidity: p<0.05; tremor: p=0.01; one-way RMANOVA), but at different progression rates (see text). Relative to baseline, significant increaes in the akinesia-rigidity and tremor ratings (p<0.05; post-hoc Bonferroni test) were evident only at the 48 month time point. *p<0.05, ***p<0.0001, post-hoc Bonferroni test relative to baseline.
B. Mean (±SE) PDTP (squares) and PDRP (diamonds) scores at baseline, 24 and 48 months. The expression of both patterns increases significantly over time (PDTP: p=0.01; PDRP: p<0.0001; one-way RMANOVA). The time course of network activity differed for the two patterns (p<0.01), with a slower rate of progression for PDTP (0.10 point/year, p<0.05) relative to PDRP (0.51 point/year, p<0.0001). Relative to baseline, there was no change in PDTP expression at 24 months (p=0.99; post-hoc Bonferroni test), although a significant increase was evident at 48 months (p<0.05). However, significant increases in PDRP expression were evident at both the second (p<0.05) and third time points (p<0.0001). *p<0.05, ***p<0.001, post-hoc Bonferroni tests with respect to baseline.

