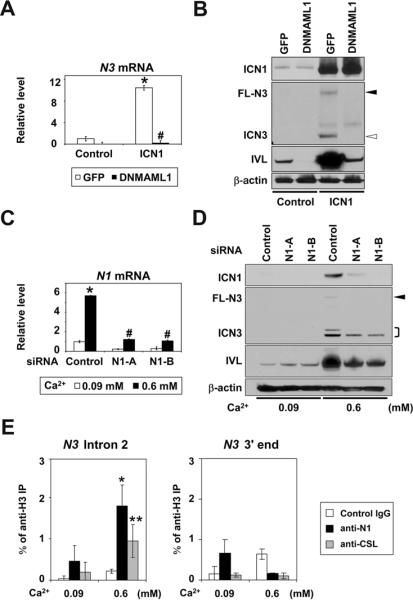
Figure 5.
ICN1 directly induces and activates N3 through CSL-dependent transcription in esophageal keratinocytes
EPC2-hTERT cells expressing either DNMAML1 or GFP (control) were transduced with ICN1 to determine (A) N3 mRNA and (B) N3 protein levels 72 hrs after retrovirus infection. In (C) and (D), EPC2-hTERT cells were stimulated with Ca2+ for 72 hrs following N1 siRNA transfection to determine indicated molecules. Real-time RT-PCR and Western blotting determined mRNA and protein, respectively. β-actin served as an internal or loading control in (A)–(D). *, P< 0.001 vs. GFP + control or 0.09 mM Ca2+ + siRNA control; #, P< 0.001 vs. ICN1 + GFP or 0.6 mM Ca2+ + siRNA control; n=3 in (A) and (C). Closed arrowhead, FL-N3; open arrowhead, ICN3;], doublets of ICN3. In (E), cells were stimulated with Ca2+ for 48 hrs for ChIP assays with indicated antibodies. *, P< 0.01, **, P< 0.05 vs. 0.09 mM Ca2+; n=3.

