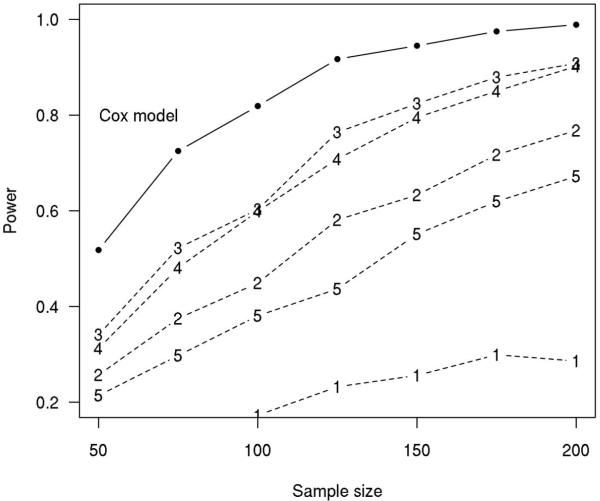
Fig. 4. Simulation Results.
Estimated power as a function of sample size for competing statistical approaches based on Weibull model simulations. The power of the Cox model approach is indicated by the solid black line while the power of the two-sample approaches are indicated by a dashed line with the numeric symbol indicating the follow-up cutoff in years from baseline. Here we assume the predictor x is normally distributed with mean 0 and SD 1 and that the hazard ratio for an increase equivalent to one IQR is approximately 2.

