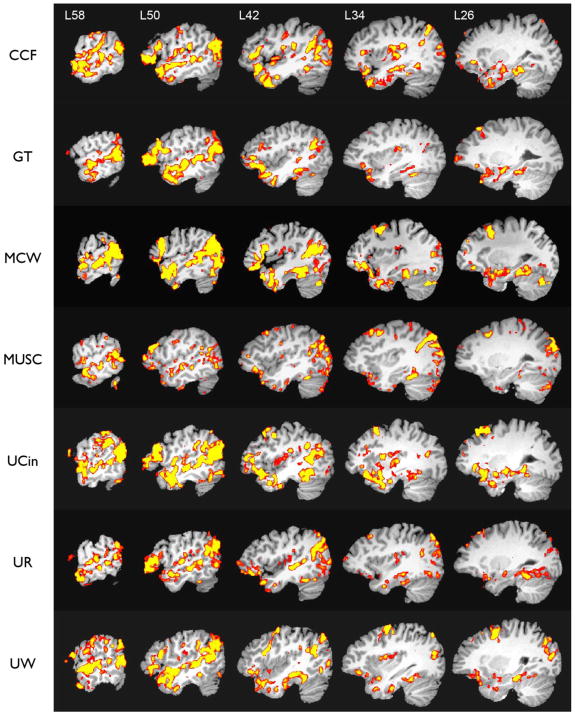
Figure 5.
Representative individual subject activation maps (one subject from each center), shown in serial sagittal sections through the left hemisphere after stereotaxic normalization. Colors indicate areas of greater activation for the Story condition relative to the Math condition, thresholded at whole-brain corrected p< .05.

