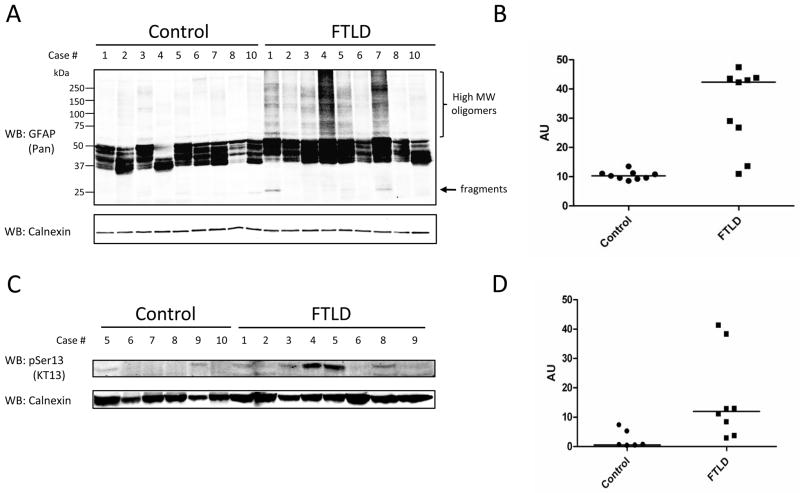
Figure 5. Analyses of pan-GFAP and GFAP Ser13 phosphorylation in human brain.
(A) Western blot analysis for pan-GFAP in control and FTLD cases. High molecular weight bands in FTLD cases may indicate oligomeric/modified GFAP; immunoreactivity between ~25–50 kd may represent degradation isoforms 80, 81. (B) Quantitative analyses of western blot indicates mean GFAP levels are ~3-fold higher in FTLD (p value = 0.0001). (C) Western blot analyses for pSer13 GFAP using clone KT13 antibody in control and FTLD cases. (D) Quantitative analyses of western blot indicates mean pSer13 GFAP levels are ~8-fold higher in FTLD (p value = 0.045). Calnexin used as loading control for all blots. Human sample information listed in Supplemental Table S1. WB, western blot.

