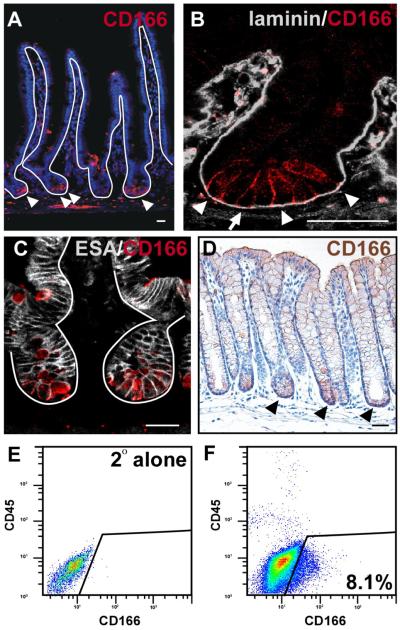
Figure 2. CD166 expression pattern in the mouse small intestine and colon.
(A-B) Mouse small intestine (SI) stained with antibodies to CD166 (red) and (A) counterstained with Hoechst (blue) or (B) co-stained with antibodies to laminin (gray) in higher magnification of the crypt. Arrowheads mark CD166-expressing cells. Arrows mark columnar crypt-based cell in B. (C) Mouse small intestinal crypt co-stained with CD166 (red) and the pan-epithelial ESA (white). (D) Mouse colon stained with antibodies to CD166 (brown), demonstrating enhanced expression in the crypt base (black arrowheads). Solid lines denote the epithelial-mesenchymal boundary. Bar=25μm. (E) Flow cytometry isotype control on isolated intestinal epithelial crypt cells. (F) Flow cytometry analysis of isolated crypt epithelial cells stained with CD166 antibodies. Box denotes CD166-positive, CD45-negative cells.

