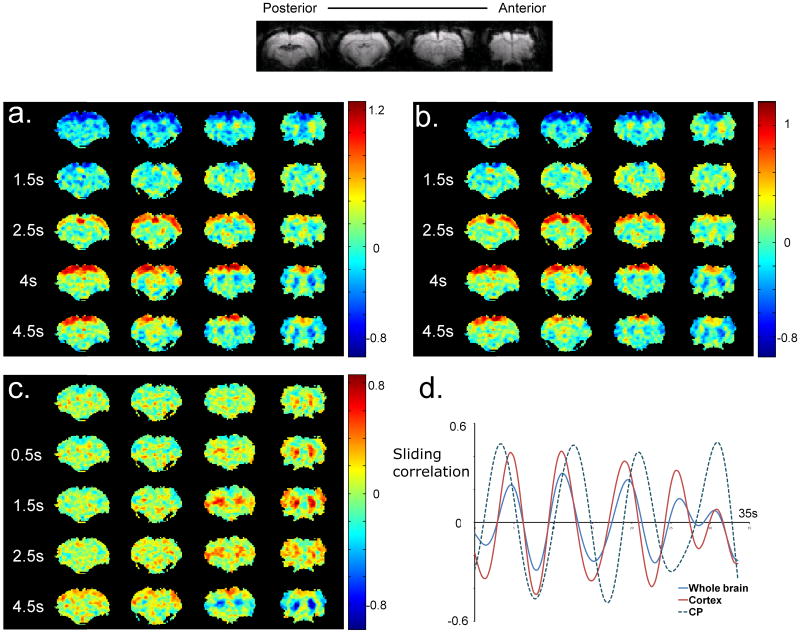
Figure 2. Templates and sliding correlation time-courses for one rat.
a) Five frames from a template obtained with an ROI covering the whole brain are shown. A propagating wave of high intensity can be observed in all the slices, followed by a propagating wave of low intensity in the same direction. The second frame (1.5 s) shows the onset of the waves, marked by increased intensity in the lateral cortical areas. The later frames show the propagation of the high intensity towards the medial areas, followed by a wave of low intensity in the same direction. b) The propagation pattern with an ROI covering just the cortex is almost identical to that obtained with the ROI covering the whole brain. The templates obtained with either ROI are highly correlated (cc = 0.87±0.11, averaged over all the rats). c) The spatiotemporal pattern obtained with CP-based ROI shows alternation of positive and negative signal intensities in CP. The increase in BOLD signal is focal in the beginning (0 s) and expands to fill the entire CP. d) Sliding correlation with respective templates for 3 different ROIs. Peaks in the sliding correlation time-course occur at nearly identical time-points for the ROIs covering whole brain and cortex. The correlation time-courses for CP and the other ROIs are sometimes well-aligned, while at other times they are out of phase.

