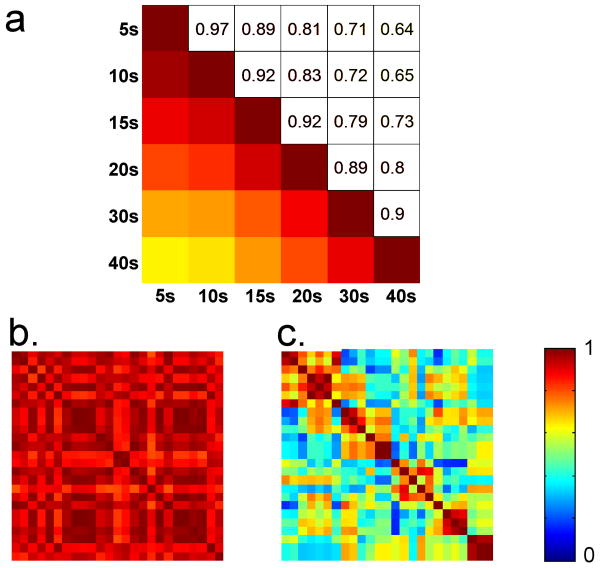
Figure 6. Sensitivity to the initial parameter for human data.
a) Pairwise optimal correlation between the sliding correlation time-courses with different window lengths (averaged over 12 sessions). Correlation time-course for 20 s window length is very similar to those obtained from window lengths ranging from 5 s to 40 s (cc > 0.8). Therefore it is not necessary to have exact knowledge about length of the pattern to be detected. However, relatively low correlation is observed between longest and shortest window lengths. b) Correlation matrix representing pairwise optimal correlation between the templates obtained using 25 random starting points for a human dataset. The templates obtained with different seed time-points are highly correlated for this dataset. c) Correlation matrix obtained from another human dataset (the data points were re-ordered in order to emphasize the clusters of similar templates). For this particular dataset, not all the templates with random seed-points show high correlation. b and c suggest that depending upon the data set, the seed time-point may or may not have an impact on the results.

