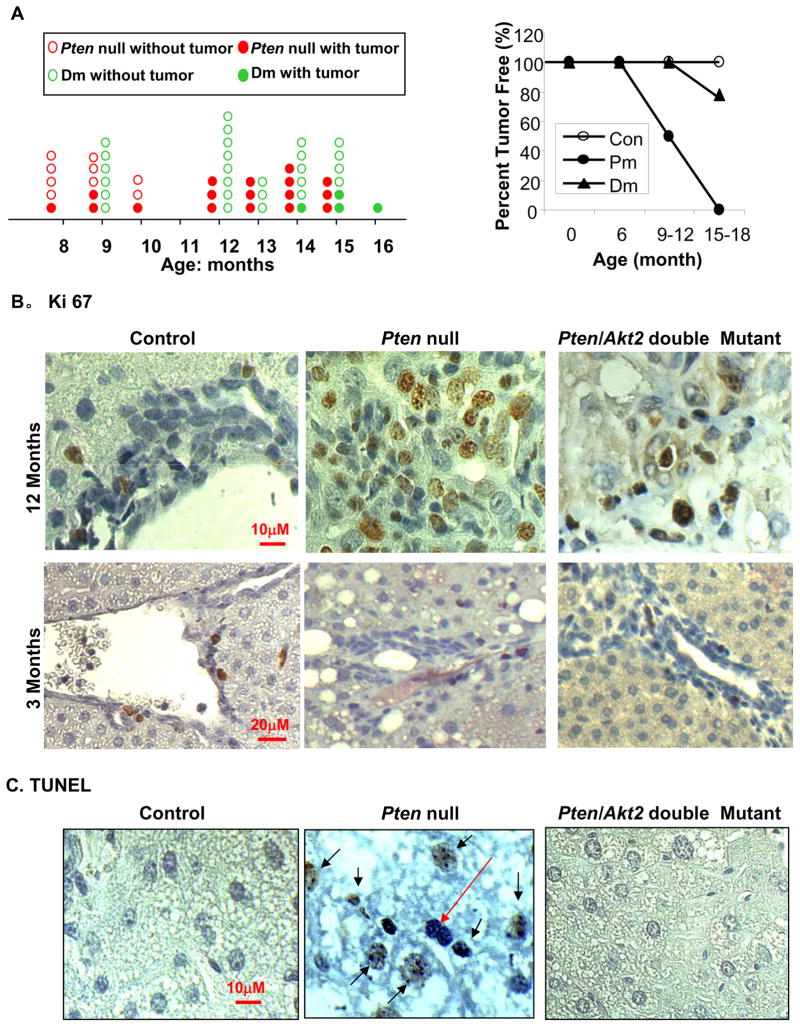
Figure 1. Akt2 deletion inhibits tumor growth in Pten null mice.
A. Left panel, tumor spectrum. Each red circle represents one Pten null (Pm) mouse. Each green circle represents one Pten/Akt2 double mutant (Dm) mouse. The solid circles represent mice with tumors and open circles represent mice with tumors. Right panel, tumor data presented as percentage of the total number of animals evaluated. B. Liver sections were stained with a cell proliferation marker Ki67 (brown nuclei staining). Top panel, 12 month old mice. Bottom panel, 3 month-old mice. C. Liver sections were stained with TUNEL (brown nuclei staining) to identify apoptotic cells. All sections were counterstained with hematoxylin for nuclei identification. Black arrows: TUNEL positive cells. Red arrow: TUNEL negative cells.

