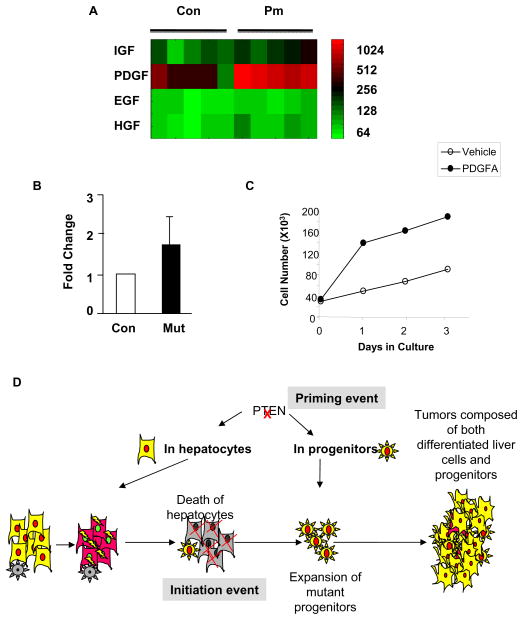
Figure 7. PDGF is potential growth factor mediating the progenitor cell expansion in the Pten null mice.
A. Heatmap of microarray analysis of expression for IGF, PDGF, EGF and HGF. Expression of PDGF is robustly induced in the Pten null (Pm) mice vs. the Controls. Each square represents one mouse. Relative level of expression is indicated with color intensity. Color scale (log scale) is provided as reference. B. Quantitative PCR data confirming the upregulation of PDGF in the Pm liver. C. Growth curve of PDGF and vehicle treated progenitor cell cultures. Solid circle, PDGF (25ng/ml) treated culture; Open circle, vehicle treated culture. D. Schematic representation of tumor progression in the Pten null mice.

