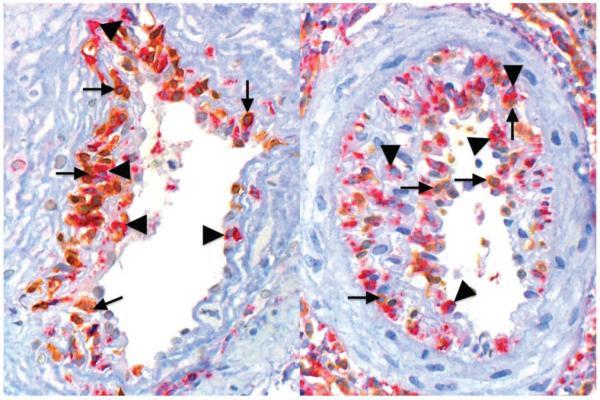
Fig. 1.

Immunohistochemistry for CD68 (red staining, triangles) and CD3 (brown staining, arrows) of kidney allografts demonstrating T-lymphocyte-(left) or MO-dominated (right) intimal arteritis. Ratios CD68/CD3 were obtained counting manually the number of each cell population within intima of all arteries in each biopsy specimen or of the five biggest arteries in each surgical specimen.
