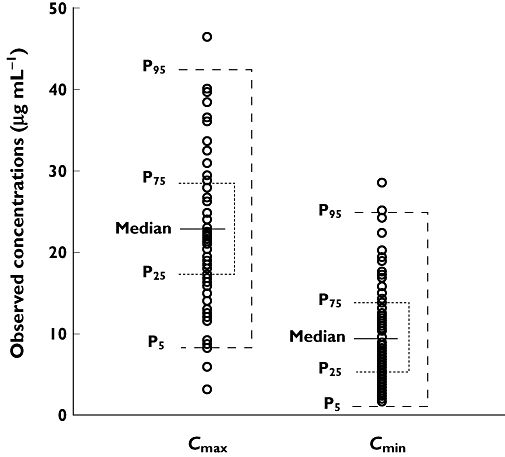
Figure 2.

Visual predictive check of the final model for vancomycin. Symbols are the observed concentrations and the horizontal lines indicate the median and percentiles (5th, 25th, 75th and 95th) of vancomycin concentrations simulated with the final model. The intervals P5-P95 and P25-P75 cover the 90% and 50% predicted concentrations, respectively
