
Fig. 1.
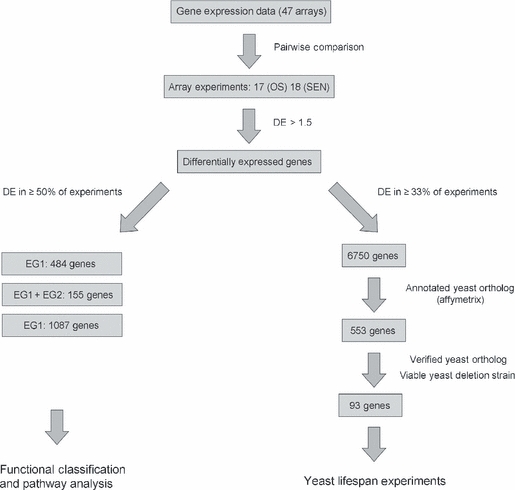
Workflow for candidate gene identification and functional classification. First, gene expression data from 47 microarrays were processed to identify differentially expressed (DE) genes in experimental group 1 (EG1) and experimental group 2 (EG2). The selection of genes for functional classification and pathway analysis, starting from a total of 1566 genes, is shown (left arm). In the right arm of the diagram, the strategy to identify yeast genes for testing in lifespan analysis is depicted.