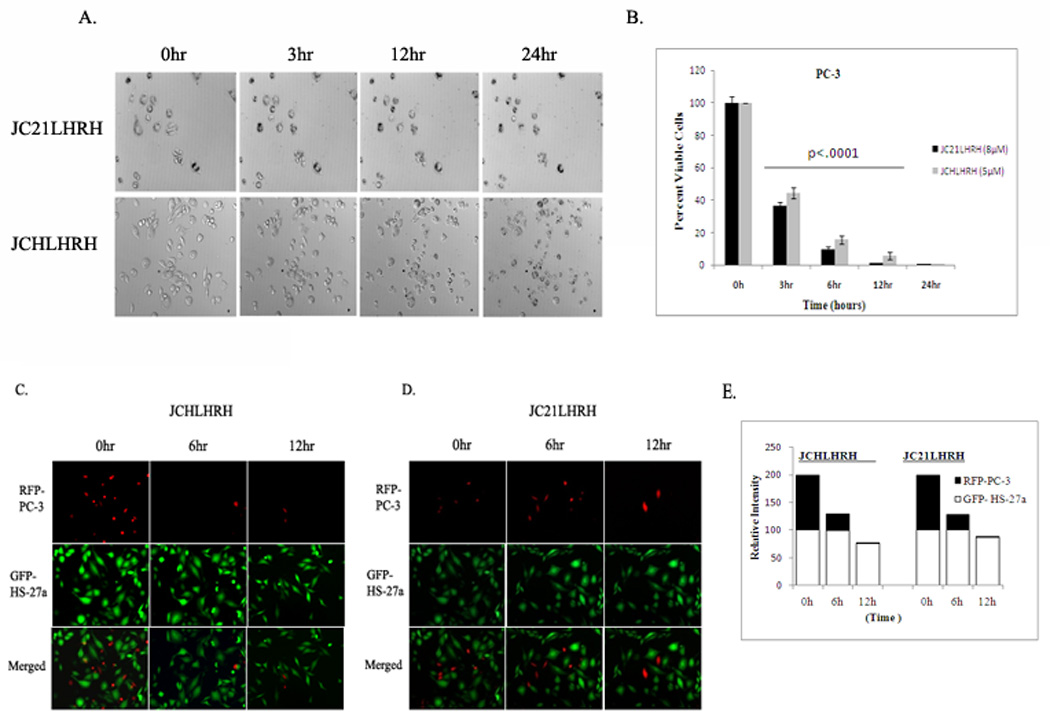
Figure 5. Real-time images of cytotoxicity of lytic peptides in hours.

A.) PC-3 cells were exposed to JCHLHRH (5 µM) or JC21LHRH (8 µM) and imaged continuously for 24 hr with time-lapse microscopy. Phase contrast images, selected from time-lapse microscopy at 3, 6, and 12 hr, are representative of two individual experiments with similar findings. The time-lapse movie can be found in Supplemental Data (5E & F). B.) Quantification of total cell number and cell viability was determined by trypan blue exclusion after exposure to JCHLHRH (5 µM) or JC21LHRH (8 µM) over a 24 hr period. Results shown are representative of three individual experiments performed in triplicate (---- (bar) indicates significance at p < 0.001). C). Exposure of JCHLHRH (5 µM) or D.) JC21LHRH (8 µM) to RFP-PC-3/GFP-HS-27a co-cultures was determined by differential immunofluorescence over 12 hr period. Images shown are representative of two individual experiments with similar results. (E.) Relative Intensity of total areas measured differential fluourescence of co-culutres.
