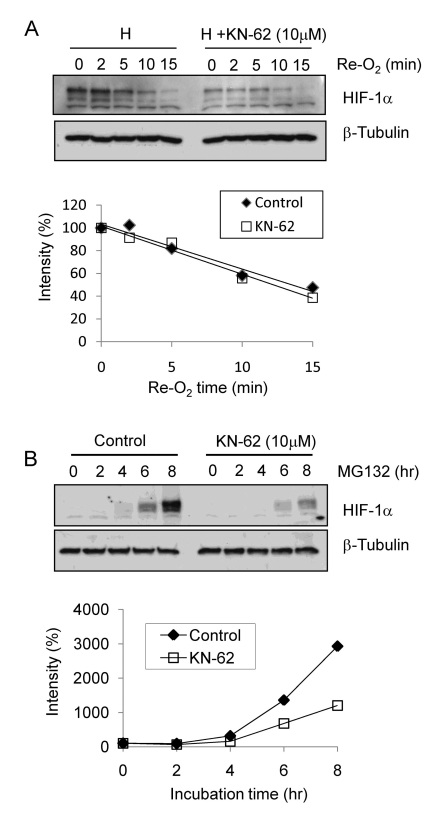
Fig. 4.
The protein level of HIF-1α was regulated by synthesis rate. (A) Top: Hep3B cells were treated with 1% O2 for 8 hr with or without KN-62 and re-oxygenated for the indicated time. Western blot signals of HIF-1α and β-tubulin are detected. Bottom: The HIF-1α protein band densities were quantified using the ImageJ program and plotted as a function of time. (B) Top: Western blot signals of HIF-1α and β-tubulin are detected with Hep3B cell extract treated with MG132 with or without KN-62 for the indicated time. Bottom: The protein band densities were quantified using ImageJ and plotted as a function of time.

