
Figure 1.
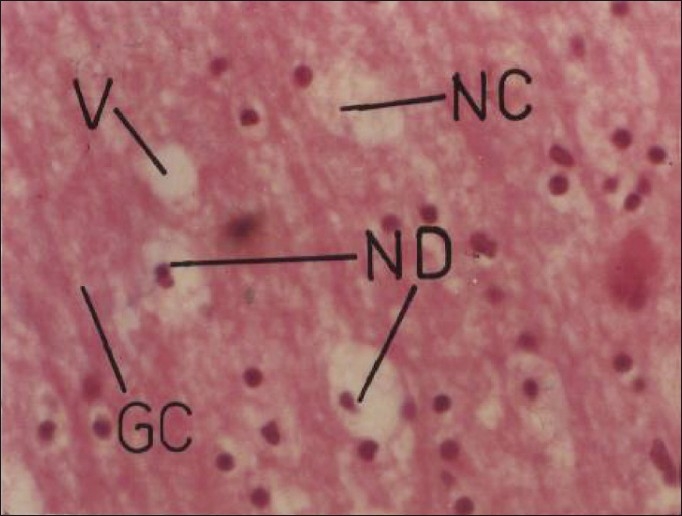
Photomicrographs of a section of cerebrum of rat showing necrosis and vacuolization with neuronal degeneration and marked increase in glial cells. H and E, ×200 (Cypermethrin, 20 mg/kg/day, 30 day) GC = glial cells; NC = necrosis; ND = neuronal degeneration; V = vacuole