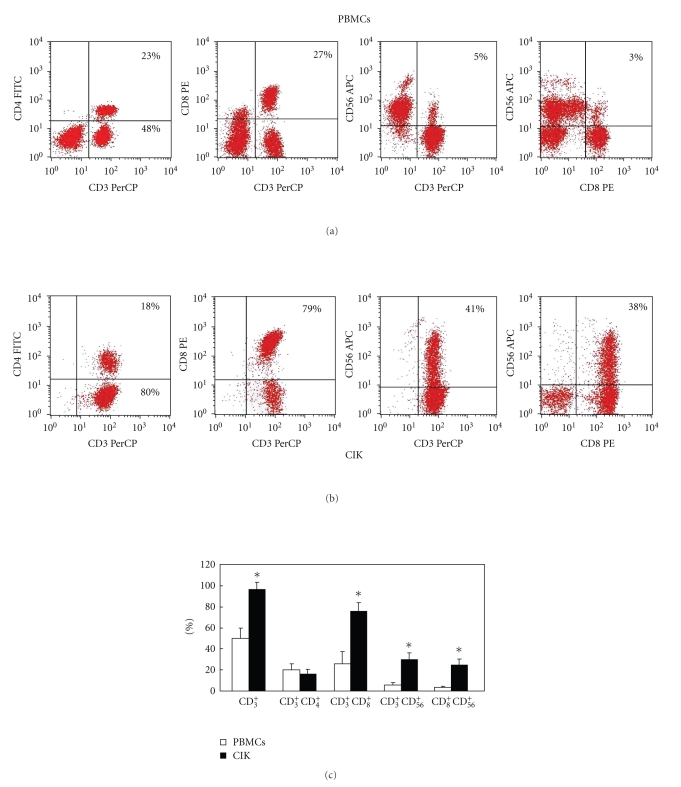
Figure 1.
Phenotypic analysis of CIK cells. All cell samples were stained with PerCP-conjugated antibodies against CD3, FITC-conjugated antibodies against CD4, PE-conjugated antibodies against CD8, and APC-conjugated antibodies against CD56. (a) Typical phenotypic analysis of PBMCs. (b) Typical phenotypic analysis of CIK cells. (c) Comparison of the phenotypic analyses of PBMCs and CIK cells. The PBMCs population was composed of 50% CD3+ cells, 4% CD3+CD56+ cells, 27% CD3+CD8+ cells, 22% CD3+CD4+ cells, and 3% CD8+CD56+ cells. After culture for 14 days, the CIK cells comprised 98% CD3+ cells, 77% CD3+CD8+ cells, 20% CD3+CD4+ cells, 38% CD8+CD56+ cells, and 41% CD3+CD56+ cells. Phenotypic comparison analysis was performed from 15 samples, and the results are expressed as means ± SD. (*P < .05)

