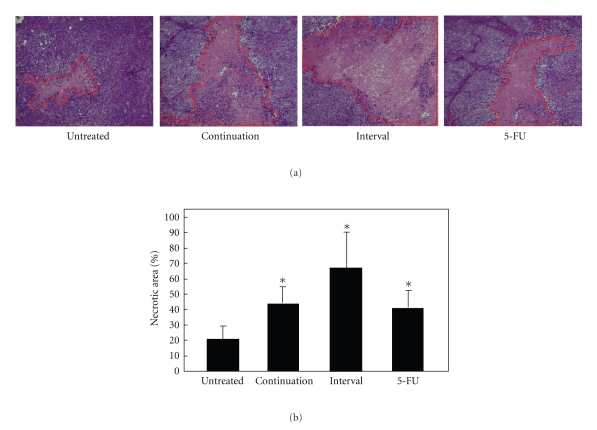
Figure 4.
Pathological observation of the necrotic area of the xenografts. HE staining ×200. Representative examples of the necrotic area in the four different groups are shown (a). Necrotic area was calculated with Image-Pro Plus Version 4.5 (b). Standard deviations and P values were calculated with Student's t-test (P < .05).

