Figure 4.
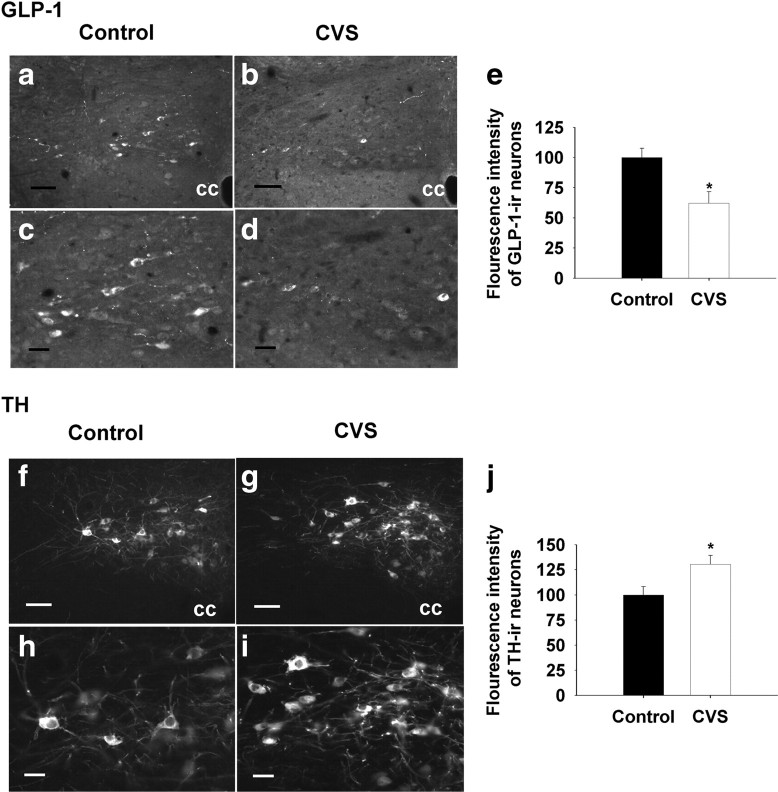
Quantification of the densitometrics of GLP-1- and TH-immunoreactive positive neurons in the NTS after 2 weeks of CVS exposure. a–d, f–i, Representative images of GLP-1- and TH-immunoreactive positive staining at the level of bregma (−14.40); low-magnification images are shown at the top, and high-magnification images are shown at the bottom. Left, Control; right, CVS. e, Decrement of the densitometrics of NTS GLP-1-immunoreactive positive neurons in the CVS-treated rats compared with the control group. j, Increment of densitometrics of NTS TH-immunoreactive positive neurons in the CVS-treated rats compared with the control animals. Data are shown as the percentage of control. cc, Central canal. Scale bars: a, b, f, g, 50 μm; c, d, h, i, 20 μm. *p < 0.05 versus control.

