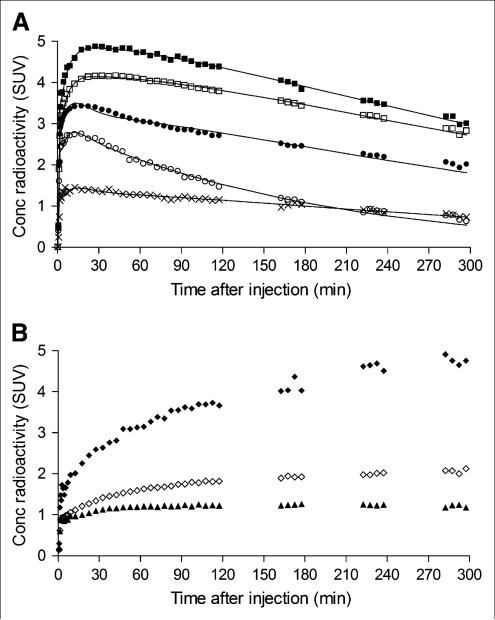
FIGURE 3.
Time–activity curves of 18F-FMPEP-d2 in brain from single subject scanned for 300 min. (A) Decay-corrected measurements from putamen (■), prefrontal cortex (□), cerebellum (•, pons (○), and white matter (×) were fitted with unconstrained 2-tissue-compartment model (–). Putamen was consistently region of highest brain uptake. White matter was consistently region of lowest brain uptake, followed by pons. (B) Decay-corrected measurements from same subject demonstrate uptake of radioactivity in clivus (◆), occiput (◇), and parietal bones (▲). Concentration (Conc) is expressed as SUV, which normalizes for injected activity and body weight.

