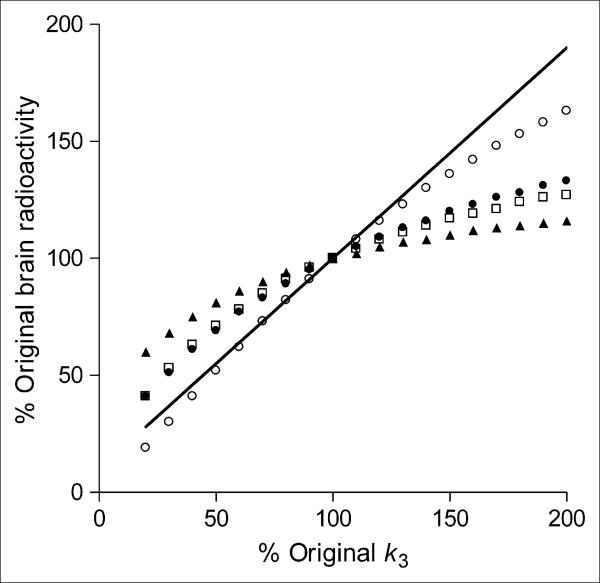
FIGURE 6.
Simulated changes in brain uptake with variations of receptor density. Average individual kinetic parameters from prefrontal cortex were used to simulate expected changes in brain uptake at 280–300 (○), 0–300 (•), 90–120 (□), and (▲) 20–60 min. Changes in receptor density were simulated by varying value of k3 from its mean value (set at 100% on x-axis). As expected, value of VT (shown by line that has y-intercept equal to K1/k2) is directly proportional to changes in k3.

