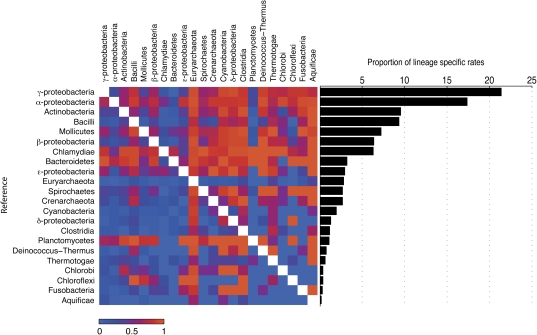
FIG. 7.—
Rate comparisons of rlineage quartets. (a) A color-coded matrix showing the proportion of rlineage quartets in which the reference taxon (left) evolves in higher evolutionary rate than the compared taxon (top) in a 100% (red) to 0% (blue) scale. (b) Proportion of rlineage with elevated rates in the reference species from the total rlineage quartets in which the taxon is represented.

