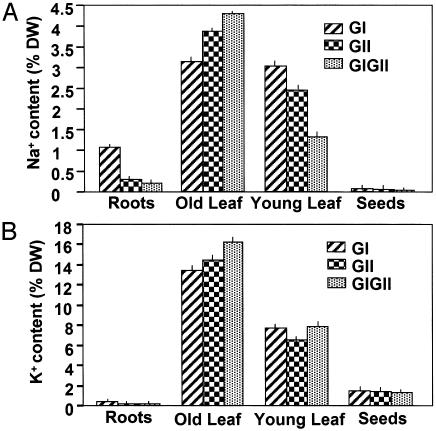
Fig. 5.
Na+ (A) and K+ (B) content [calculated as percent dry weight (DW) of the tissue] in various tissues of the glyoxalase transgenic plants (GI, gly I; GII, gly II; and GIGII, double transgenics) grown under the continued presence of 200 mM NaCl. In the histogram, each of the transgenic types is indicated by different patterned bars as shown. For each determination, roots, old leaf (fourth leaf from the bottom), young leaf (second leaf from the top), and seeds were collected from three different plants of each type. Values are the mean ± standard deviation (n = 3). Similar data for WT plants could not be obtained as these plants did not grow further in the presence of 200 mM NaCl. However, the relative values for Na+ in the WT plants grown in water were found to be 0.5% in roots, 0.1% in old leaf, 0.4% in young leaf, and 0.05% in seeds, and those for K+ were 1.5% in roots, 1.8% in old leaf, 2.0% in young leaf, and 1.0% in seeds (data not shown).

