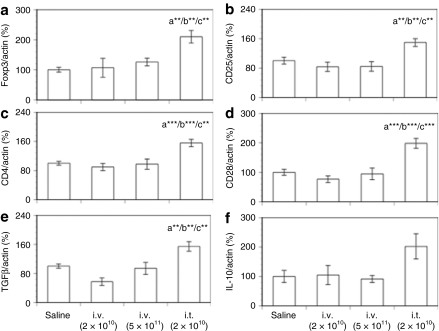
Figure 3.
Thymic mRNA levels of Foxp3, CD markers, and cytokines after intravenous or intrathymic injection of AAV8-hGAA. Thymic mRNA expression levels of (a) Foxp3, (b) CD25, (c) CD4, (d) CD28, (e) TGFβ, and (f) IL-10 were analyzed by TaqMan with preamplification (see Materials and Methods) at week 16 after AAV8-hGAA administration. Results shown are normalized to actin expression and expressed as a percentage of the saline control, and are presented as means ± SEM (N = 8–10 mice/group). Above a bar, the letter “a” represents a significant difference compared to the saline group, “b” compared to the i.v. (2 × 10¹⁰) group, and “c” compared to the i.v. (5 × 10¹¹) group. The number of asterisks following the letter denote the level of statistical significance: **P < 0.01, ***P < 0.001.

