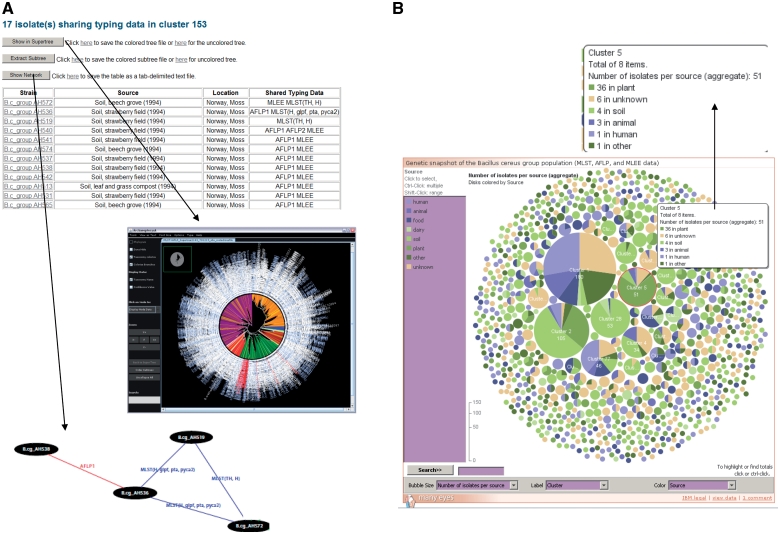
Figure 2.
Exploration of superclusters of genetically closely related B. cereus group isolates in HyperCAT. (A) Tabular view of the superclusters. Each cluster is reported in a table, listing detailed information about the isolates and the genotying profiles shared. In addition, pressing one of the three buttons above the table allows to view the phylogenetic positions of the isolates in the multi-datatype supertree using Archaeopteryx, to extract from the supertree the subtree containing only the isolates forming the supercluster, or to display a network graph showing the specific typing data shared between the isolates of the supercluster. In the latter network, isolates having identical MLST and/or AFLP profiles are connected by blue and red lines, respectively. Every isolate in the supercluster shares a profile with at least one other isolate. The network can be browsed interactively using the ZGRViewer. (B) Graphical overview of all the superclusters resulting from typing information from five MLST schemes and three AFLP studies. Superclusters were built using a recursive approach, grouping strains that shared identical sequences at all loci of at least one of the MLST schemes and/or have identical AFLP profiles. The complete distribution consists of 283 groups totaling 1152 isolates, and 991 singletons. The set of superclusters and singletons can be navigated using an interactive bubble chart generated by means of the IBM/alphaWorks ‘many eyes’ system. Each supercluster is represented by a pie proportional to the number of isolates in the supercluster and the pie is divided according to the species or sources of the isolates included in the supercluster. Selecting or mousing over a supercluster brings up a window giving information about its content (shown in the inset indicated by an arrow).

