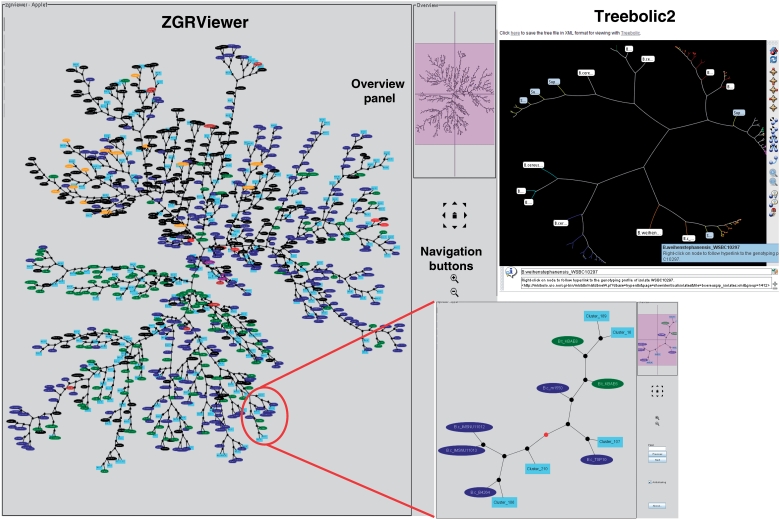
Figure 3.
Phylogenetic snapshot of the B. cereus group population based on MLST and AFLP typing data for 2143 isolates. The snapshot combines supertree and supercluster information. The supertree is represented as an unrooted network in which the closely related strains belonging to a supercluster have been replaced by a representative isolate. Superclusters are drawn as filled lightblue boxes, while singleton isolates are drawn as ellipses colored by bacterial species (red, B. anthracis; blue, B. cereus; green, B. thuringiensis; brown, B. mycoides; purple, B. pseudomycoides; orange, B. weihenstephanensis; black, uncharacterized B. cereus group isolate). The network can be browsed interactively using the ZGRViewer navigation buttons and mouse functions. Clicking on an internal node loads a new page displaying the subtree including all descendants of that node in the supertree. An example is given in the inset showing the subtree circled in red. The view in the upper right corner shows the display of the supertree in hyperbolic space using Treebolic2.

